Dashboard Overview
Project Highlights
Streaming Performance Analysis
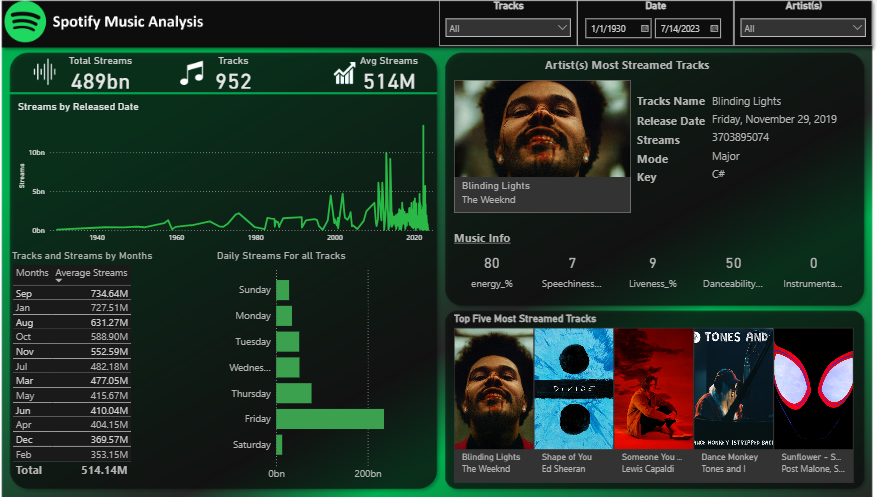
Built interactive KPI reporting to monitor total streams, track performance, average streams, and music popularity trends across Spotify streaming data.
Trend & Time Analysis
Developed time-series visualizations to analyze streaming behavior by release date, month, and daily listening trends for improved music performance insights.
Data Preparation & Modeling
Cleaned and transformed Spotify streaming datasets using Power Query and implemented DAX calculations to support dynamic filtering and interactive dashboard reporting.
Artist & Track Insights
Enabled analysis of top-performing artists, most-streamed tracks, audio characteristics, and listener engagement metrics through interactive dashboard visualizations.
Dataset Information
This project utilizes publicly available Spotify streaming datasets containing track information, artist details, release dates, streaming counts, and audio-related metrics.