Dashboard Overview
Project Highlights
Workforce Utilization
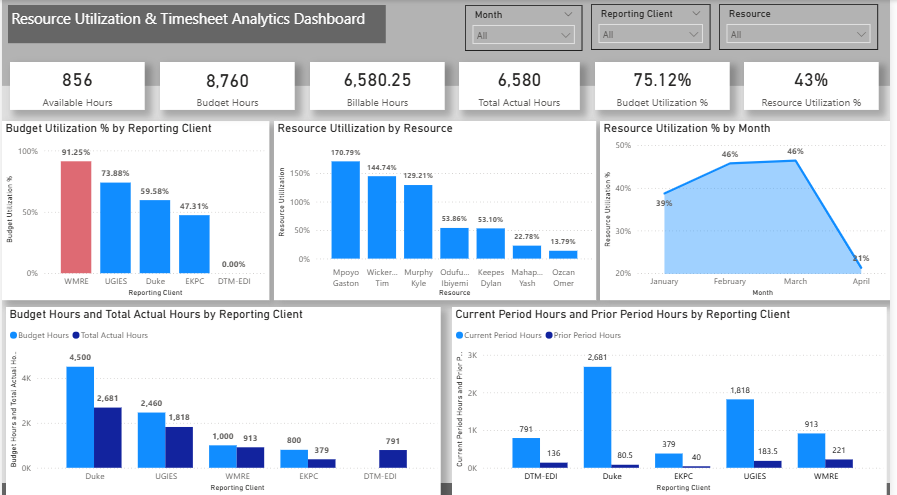
Built interactive KPI reporting to monitor employee utilization rates, workforce capacity, and operational performance across reporting periods.
Timesheet Reporting
Developed visual reporting for tracking budget hours, actual hours, and billable hours to support operational planning and resource management.
Data Modeling
Implemented dimensional modeling using fact and dimension tables with DAX calculations and Power Query transformations for efficient reporting and analysis.
Operational Insights
Enabled stakeholders to identify utilization trends, workload imbalances, and client-level performance patterns through interactive dashboard visualizations.